DFS PGA Odds, Analysis and Leverage for the BMW Championship 2025 - Draftkings Tournaments
- dfsedric
- Aug 13, 2025
- 11 min read

Updated: Aug 14, 2025
If you were like more than half the field, you likely played Scheffler last week and made a good decision with his top 3 finish. Infact several first place finishers in large GPPs did that too. So what was different between them and your lineups? We are going to explore that this week as I have some new charts to show you exactly that.
Odds and Overview
Welp its another week where Scottie is way above the field in win equity, thus despite his high ownership expectations and price, he is still considered high leverage. It comes with a forced stars and scrubs build if playing him which means the cheap guys would have to perform well like last week to make it work. That would mean someone like JT Poston due to his odds for the price. But we would need more than that for the cheap end so read til the end to see what options we have. It is a no cut event which can make that more possible to happen across 4 full rounds. Not much course history this week to pull from so theres that too.
Winning Score Targets and Ceiling
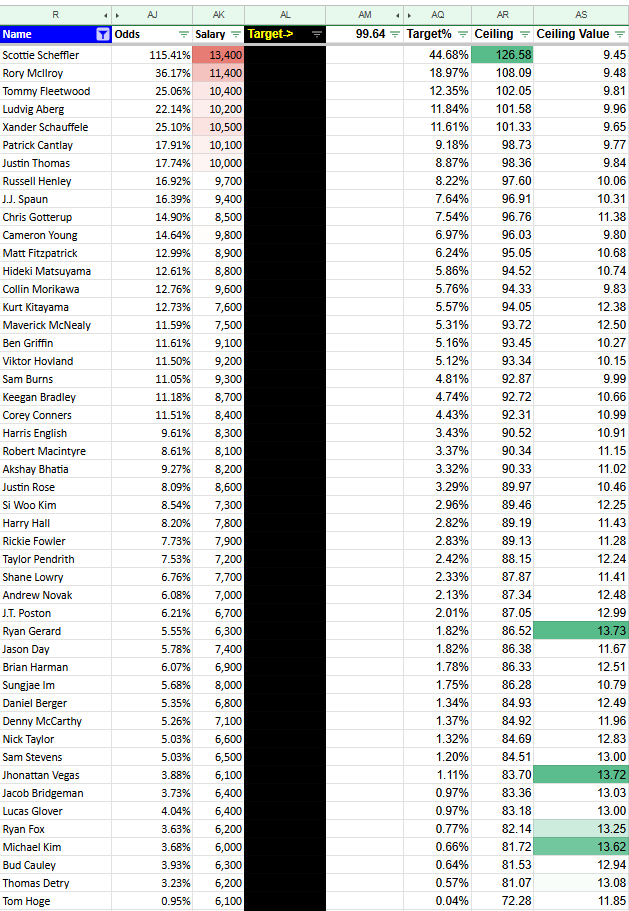
So let me return to this, page where we start with the goal in mind. I am projecting that your lineup will need to get roughly 598 points this week based on the field, and this is because this is the ceiling that most golfers get to 68% of the time. To win a large field GPP, you will still need a few players to exceed that threshold but this is a good minimum score target. Normally I'd filter this down to players who could get close to 99 points in their upside but as mentioned, we have more insights to come to help us get there on the cheap end, to avoid over filtering, especially with only 49 players in the field.
2024 BMW Optimal
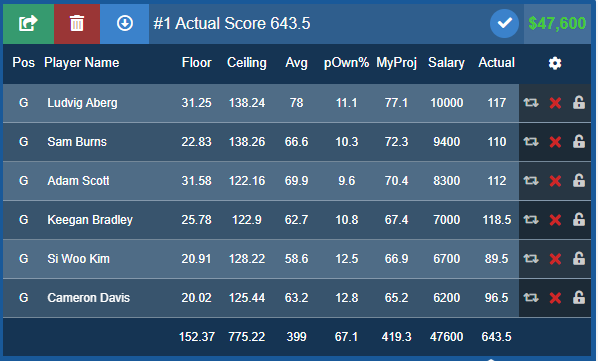
Course was played at a different venue in 2024 but this is the same event at least. Salary was not efficient as most higher end plays didnt make it even though 2 6K players did.
2021 Optimal
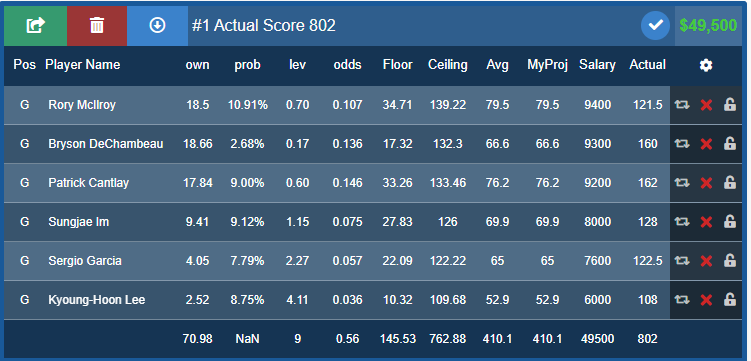
Patrick Cantlay actually destroyed this course, scoring 162 pts which is way above what I can project for his upside and others, but the actual optimal was 802 points last time they were at this venue. Will this be another birdie fest? If so, projecting the actual lineup score may be a bit more difficult.
Expected Wins vs Actual Wins
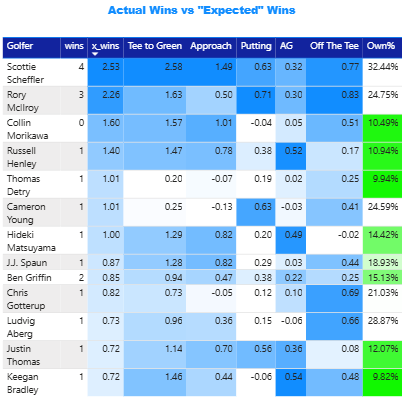
Morikawa had me shaking for a couple rounds because right when I decided to jump ship, he started competing for first. Then he said 'wait a sec, my name is Colin and I don't win..'. He is the only name on the chart that should have won by now but has no wins on the year. Since he did compete I may circle back on him if he fits the course. Russell Henley has played well enough to almost win another one.
Course Fits (datagolf)
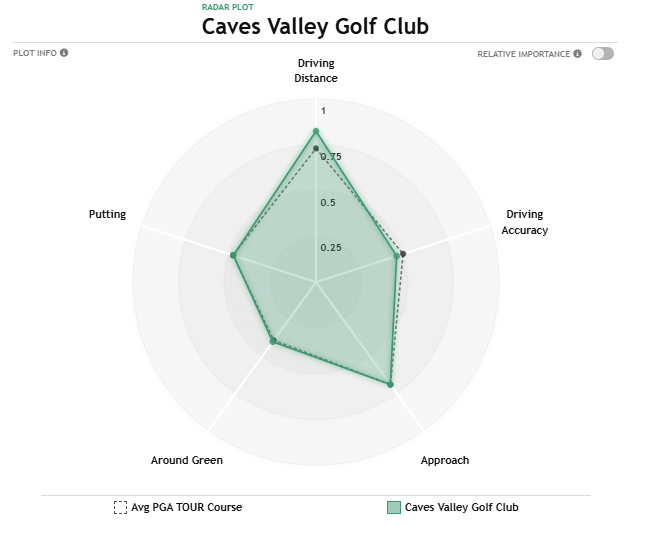
Looks like this course favors those with a bit more distance than driving accuracy, thus why Rory and Bryson finished 2nd and 3rd when this was last played here. However Cantlay did beat them both as all skillsets have importance here. The yardage on the par 3s is one of the top 5 longest. Approach shots should be on the easier end for this course as it is in the bottom 5, thus why others have found success here, specifically on approach shots over 150 yards (also in the 5 easiest) followed by putting over 15 yards out (easier side). GIR is likely a stat to monitor.
Recent Form
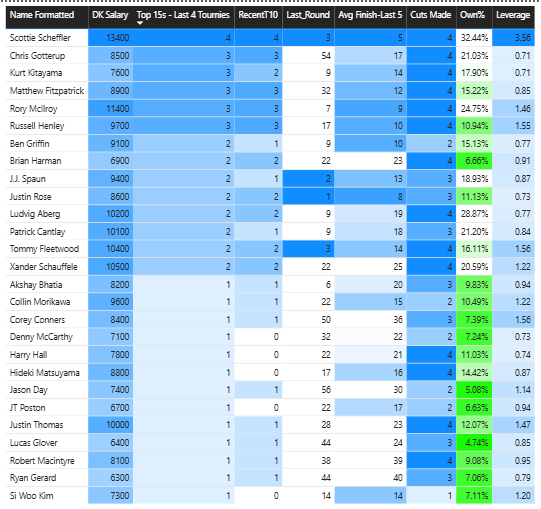
Looking at names who have finished in the top 15 of their tournaments over the last 5, this is our list, and most ownership seems to be targeting those golfers playing well this week. Henley is projecting the least ownership of the top tier and Brian Harman is also fallowing short as neither are bombers, but maybe that becomes a leverage spot as I believe Henley is one of the top approach players on tour.
Correlated Course History
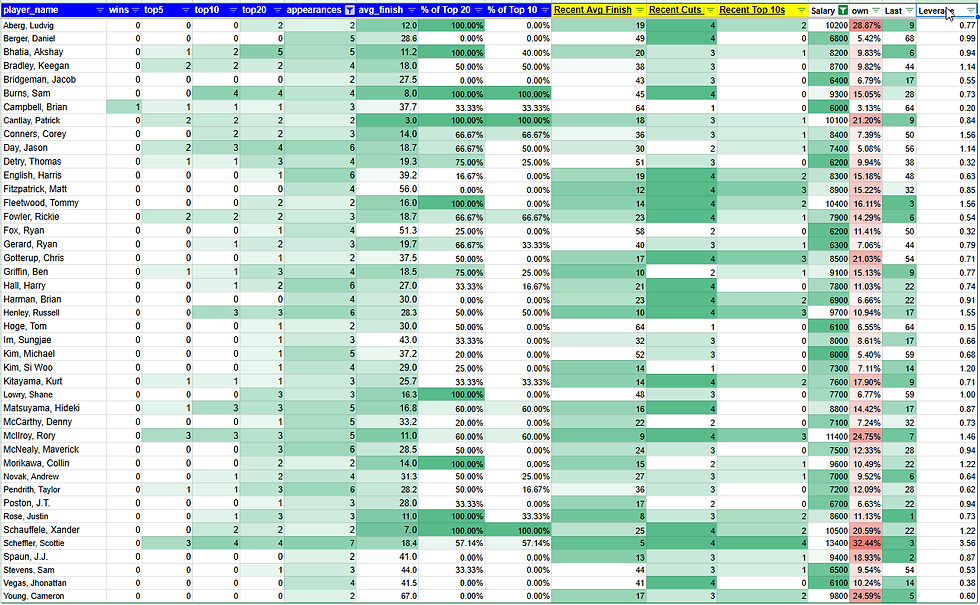
For the most similar courses, I am pulling up the history of those who have had at least 2 showings at correlated courses and how they finished at those tournaments. Some of these guys dont have any top 20 finishes, granted the field sizes were likely larger. Some did well at all of them (aka Cantlay on 3 appearances, Sam Burns on 4, and of course Scottie).
Top 20 Finish Odds
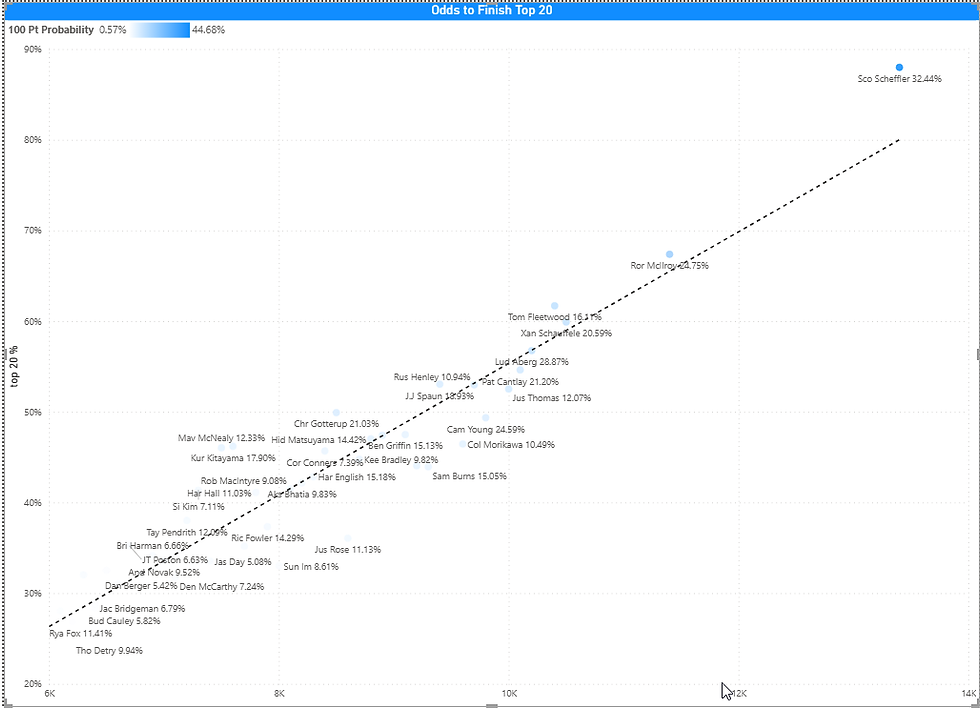
With only 49 in the field, this feels more like the make the cut odds chart. I see McNealy is standing out on the value side of things. But honestly, not sure I want a lot of weight on this chart as top 20 might not be enough to win this week as say a top 10 finish.
Top 10 Finish Odds
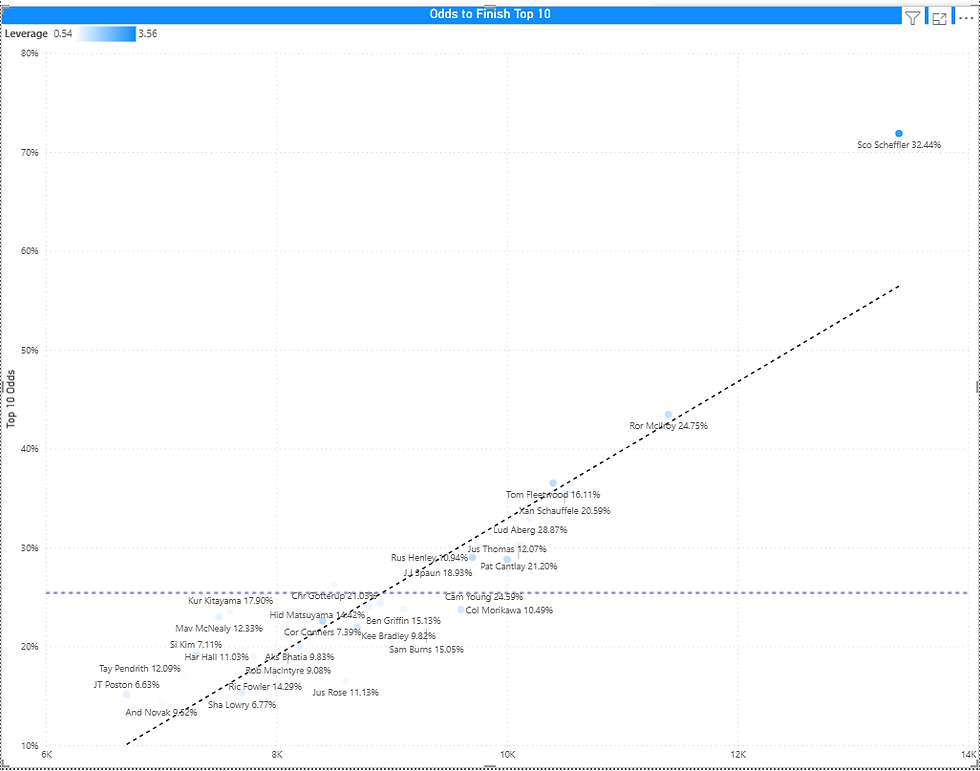
This might help a bit more. Looking at outliers at the bottom, Rose, Burns, and Morikawa stand out a lil bit, but back up top, the top 3 salaried golfers all have strong odds to finish well, with a string of cheap plays all showing in the same value space.
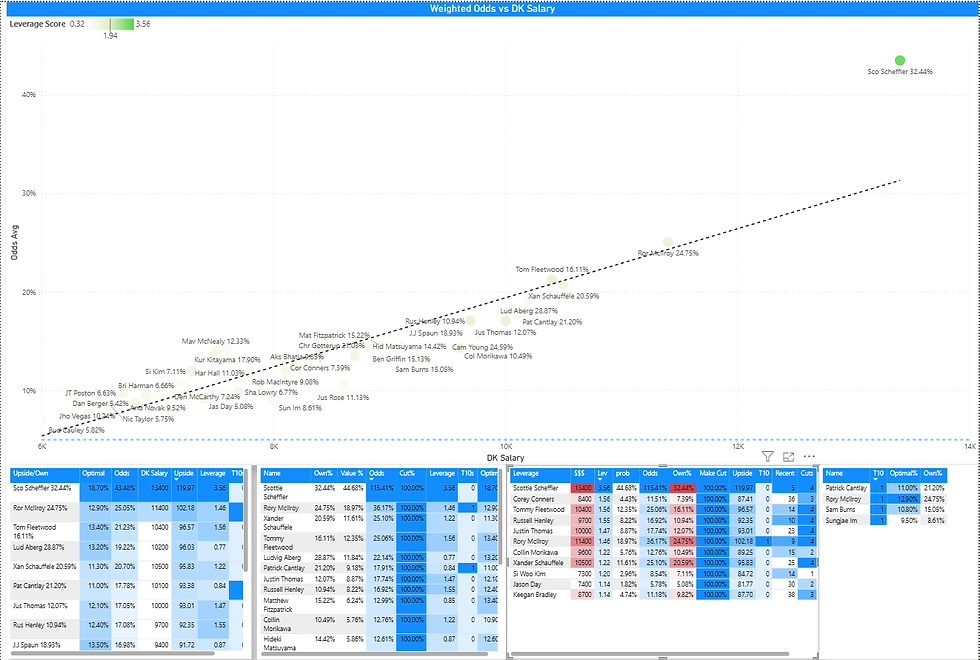
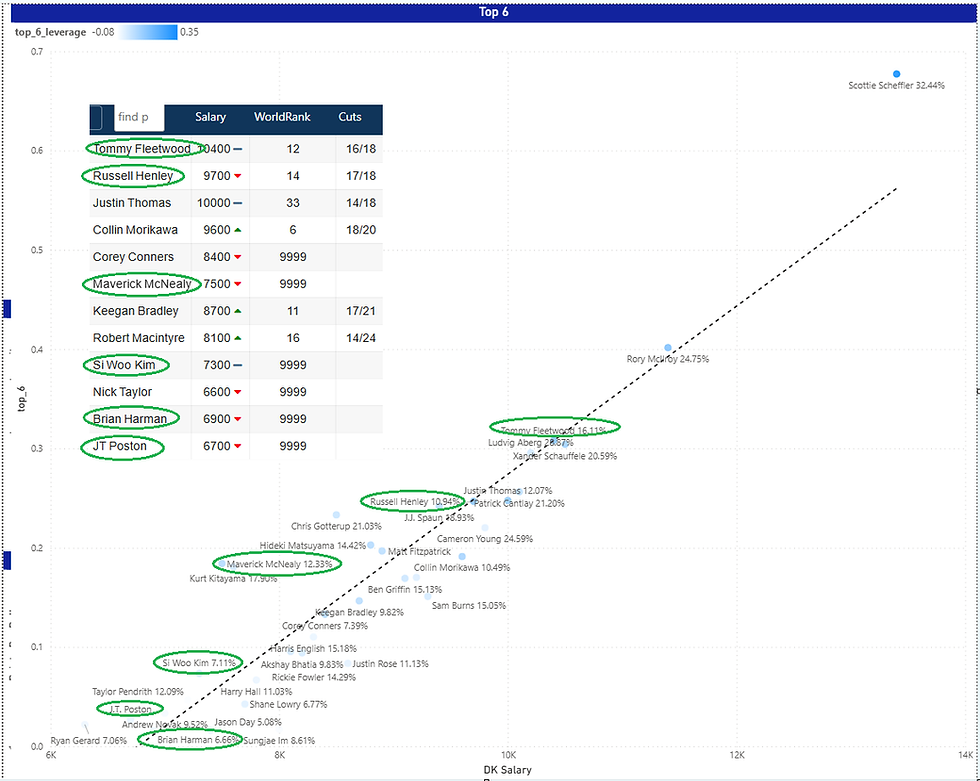
Top 6 Finish Odds with Optimal and Leverage Plays (new chart)
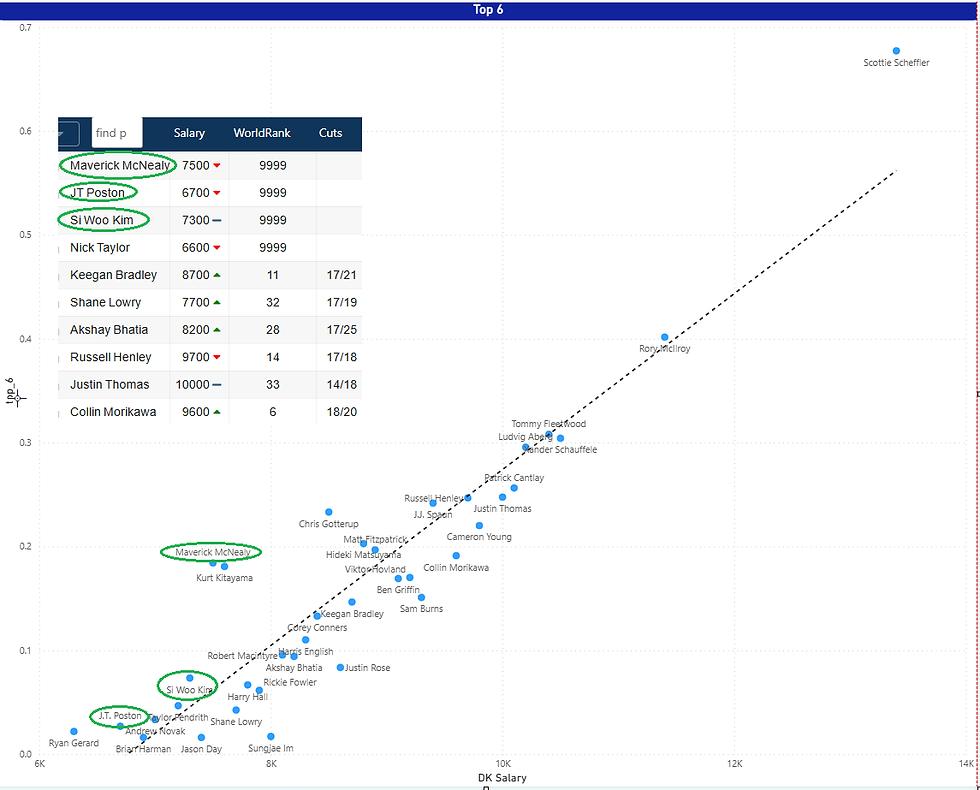
This is a new data insight I was able to create - odds of being in the top 6 of a tournament, as after all the lineups need 6 golfers so it fits the best. I filtered anyone out who had less than 1 percent of golfers, and usually I would go for the ones with the most upside as well, but I'm showing the whole field since this is the first time running it to find value (above the trend line). Sungjae is kind of an outlier on this view beneath the line. Gerard is the cheapest name on the chart above the line, but not sure if he has the upside to be in the winner.
Note: I only circle the names of those who appear above the value trend line. This week I have 3 for cheap.
Boom Factor (new chart)
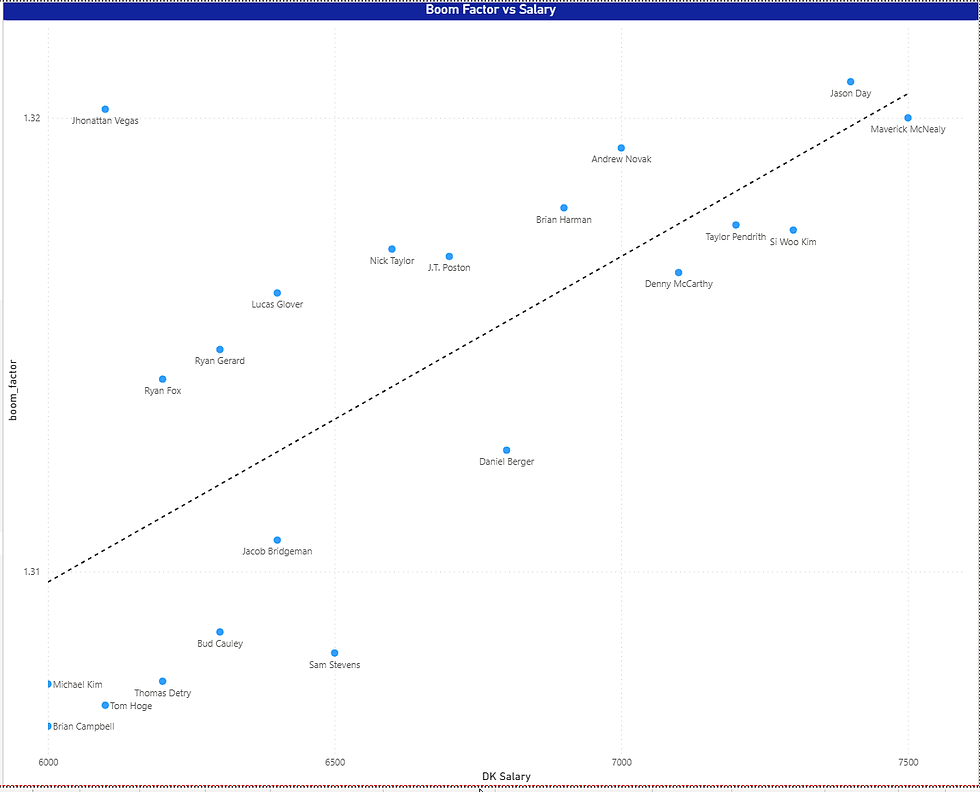
So now we look for the boom, the players who have the ability to randomly go off. The reason we removed the filters for upside is because I believe the players above this line are more equipped to put up the boom or bust scores that you need to win a tournament. Last week, Justin Rose was that guy who led to this. Essentially, what happens when you have extreme outcomes of miss cuts and then high end finishes? You are going to end up being higher on this chart, and if you are above the trend line, that means you could have some great value. I focused this view only on the cheaper plays (under 7500) because those are the guys who dont necessarily finish high in top 20 or top 10 so they will not show up on the finish odds. These guys can also fail hard too thus the term boom 'or bust'. so choose wisely. Vegas is the cheapest name on this view with one of the highest boom or bust ratings. Novak did well last week and I mentioned Brian Harman as someone playing well recently but low owned already.
More Top Lists (new data points)
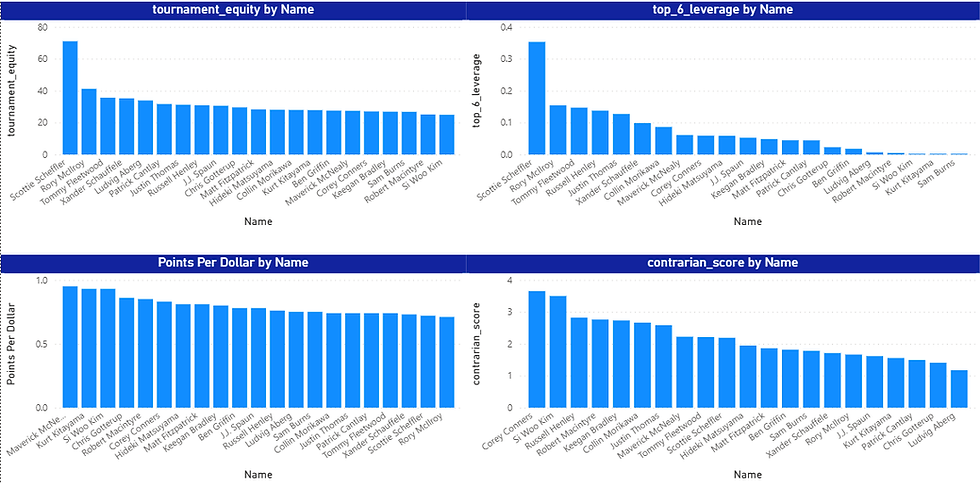
While I haven't had a ton of time to structure these charts/lists, I did end up creating new data points. I don't believe they are going to be totally actionable for now, aside from a potentially new leverage calculation on the upper right, but I put them here for review come Sunday. Note that contrarian plays and Leverage plays are not the same thing, but more to come on that as I decide what to keep next season.
PGA Sims (new)
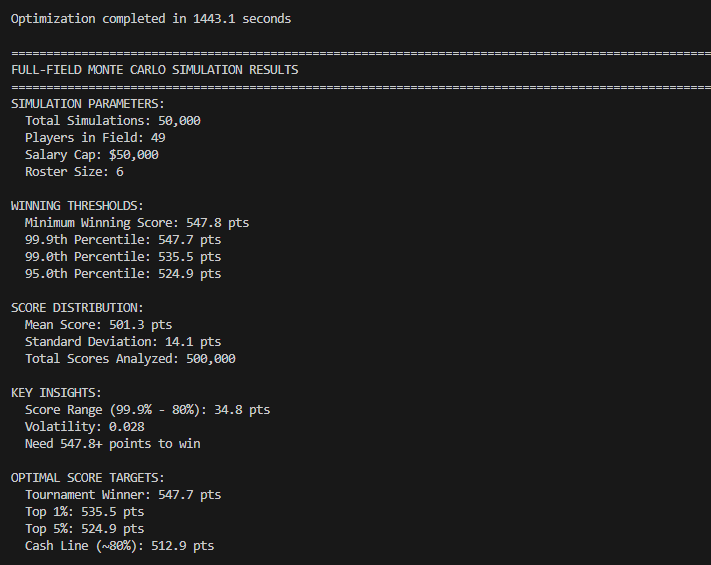
Ok so if you are wondering where I got this new data from, I set up some sims for pga against my sheet and it helped create some new insights and even some strategies to look at. Keep in mind this is only 1 day old so as I go through the next few items, I recommend you use the insights but dont hang onto the lineups generated as that would be poor usage of this system.
Players who paired in sims vs busted in sims the most
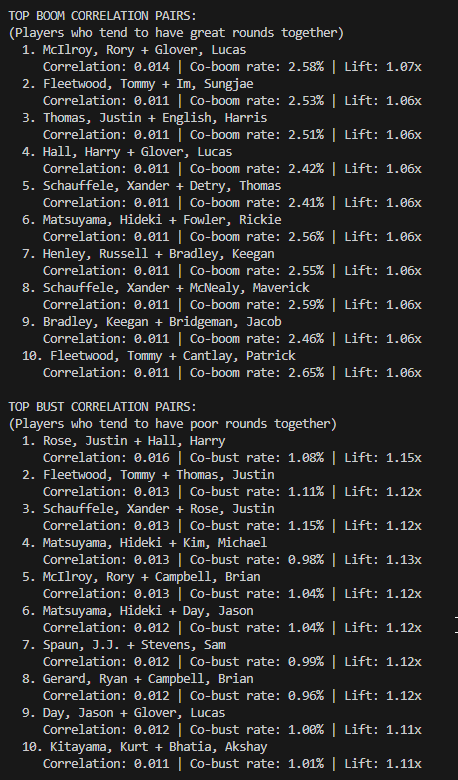
Your lineups will have certain targets, especially if using an optimizer, but even in hand builds you may decide to play a player. A lot of times, your 2nd player ends up being just like the rest of the field and this is where lineups start to break or start to take off naturally. Therefore the top list is a bunch of players who ended up in winning lineups together more often than others. The bottom are the names of pairs who busted together. For example, if playing Rory, I a not likely to play Brian Campbell with him personally. This is how you break out and build a lineup with the ability to rise or fall.
Most used plays vs Most contrarian
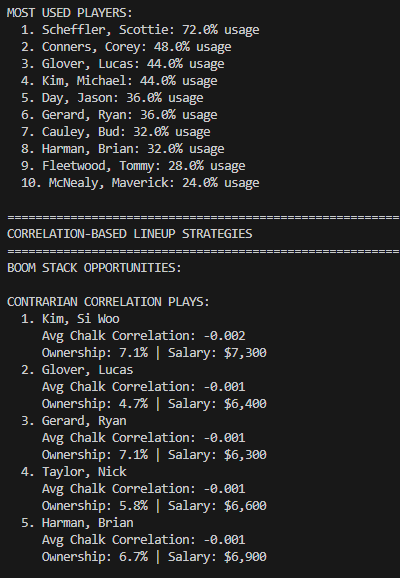
The top list of names here shows which players ended up in the simulated lineups the most, I generated 50,000 lineups in search of the top and it landed on those 10 names the most. That doesnt mean they are all going to work out but it does sort of mean that they might be the most chalky of the day.
The bottom list is of interest because if you are getting off the chalk these names have the potential to go up if the chalk fails. Note that you only need 1 of them to pan out to be great. Harman keeps showing up which means I'm going to play him in a couple lineups, but Si Woo leads this list.
Grain of Salt Lineups Produced
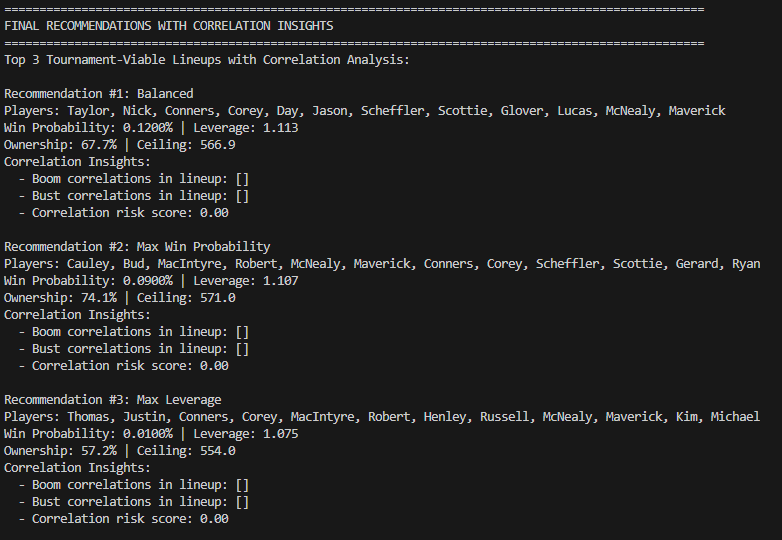
There are so many more insights in this tool but this is where I'll hop off for now. It generated 3 lineups based on 3 different strategies. I dont think they are lineups I would play as is, but could be some form of core pieces you can mix and match from to make your ultimate build. I will review the results of these insights at the end of the tournament as time permits.
If you found this information helpful, be sure to like the post that got you here!
Update! 737 am CST
The Scottie Factor
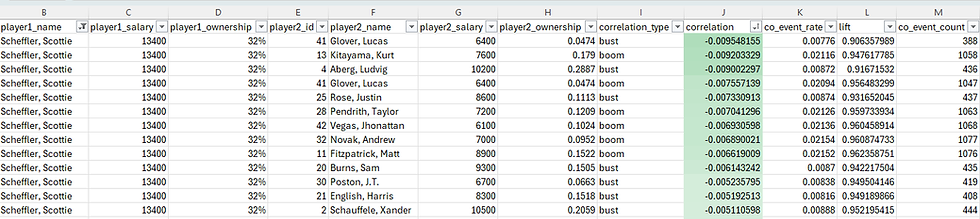
Just another peek into what is going on behind the scenes, but moreso focused on Scottie because he is the anticipated chalk of the slate. I sorted his correlations to find who negatively correlates with him the most. To be fair, none of them are super strong in the negative space. I'm going to throw Lucas Glover out since he appears twice in this data set for some reason. Next up is Kurt lineups paired with Scottie tend to do a bit better (boom) in simulations. Aberg lineups with Scottie appear to bust more often than succeed so he may be someone I do not allow lineups to pair with. But again, the weak correlations here have me thinking that Scottie may not make for many unique lineups this week at all, so I am less likely to go all in on that play this week.
Field and Terminology Defined
Boom Factor
What it means: How much upside a player has relative to their projection
1.0 = No upside (ceiling = projection)
1.3 = 30% upside potential (ceiling is 30% higher than projection)
1.5 = 50% upside potential
Example: Player projected 75 pts, ceiling 90 pts → Boom Factor = 1.2 (20% upside)
Tournament Equity
What it means: Overall tournament value combining all finish probabilities and ceiling
Higher score = better tournament equity
Weights wins heavily (100 pts) but also values consistent top finishes
Contrarian Score
What it means: Tournament value per unit of ownership
High score = Great tournament equity with low ownership (leverage!)
Low score = High ownership relative to tournament value (chalk)
Identifies the best "bang for your ownership buck"
Volatility Score
What it means: Boom/bust potential ratio
High score = High ceiling relative to floor (boom/bust player)
Low score = Consistent player with tight range
Measures upside vs downside variance
Example:
Player A: 90 ceiling, 75 projection, 60 floor → (90-75)/(75-60) = 1.0
Player B: 100 ceiling, 75 projection, 70 floor → (100-75)/(75-70) = 5.0 (more volatile)
--------------------------------------------Updated 7:00pm---------------------------------------------------
Reran ownership and projections to see if anything shifted. I think the optimal percentages are really interesting this week. These names stuck out so I do plan to look a bit deeper into a few lineup types. This one says balance has a shot. I like this chart because it gives about 2 or 3 names that people are ignoring due to low projections that they likely shouldn't. I'm going to root for Harman, Poston and Kim on the low end based on what I got from sims. The top end I have Fleetwood in play again and some thoughts on Henley. McNealy is someone that never does well when I play him so theres that. Next up; I am very much curious on the top optimal projection lineup. Note the optimal never really pans out so I dont recommend playing this, but instead using them to reference for potential lineup construction.
Optimal Projections (not to play but to reference)
Just looking at the circled dots

Surprisingly you can build a lineup with all 6 of those circled and maximize the salary. I dont usually see that pan out with more than half of those names circled, but i will enter one just to track the 6 easier.
Raw projections

So if solely using the projections, this is what I am seeing come up. This lineup is likely one that finishes in the 50th percentile of contests and ties with 50 people so dont play it, BUT it is a foundation for those who look for a starting point. I also recommend using it to think about pivots. Maybe 2-3 names need to pivot to turn it into a winner?
Longhot upside ( 8K players reach this upside 1% of the time)

Also another intriguing setup of forcing upside in the low end. I may run this one just to track it.
Pivot Potential
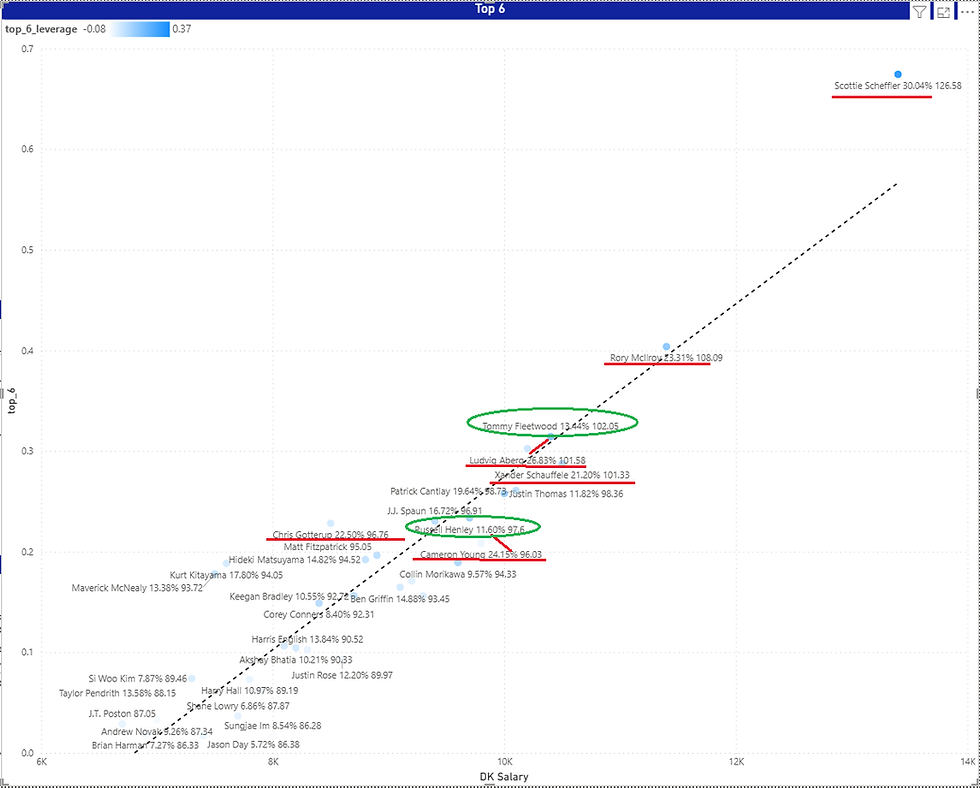
There are 6 guys on the list who project over 20% owned, which means that the small field is bringing the ownership to a consolidated state around either recent play (Gotterup and Cam Young) or top odds Scottie or high consistent plays for decent price (other circles). Not all of these guys are going to fail. However its also impossible to play all of them too. I see 2 pivot opportunities and circled them. The 3rd would potentially be a fade on Scottie if you believe a balanced build wins this week, as both him and Rory are in a league of their own. The otherwise first pivot I'll mention is Cam Young to Russell Henley. This one doesnt feel too great but Henley has been quite strong in the stats and has similar upside (1 pt more) at a high level. This wont feel good going from a bomber to a shorter hitter on this course since it does require length, and neither are above my value line.
The 2nd pivot worth calling out is Aberg to Fleetwood at a similar price. Fleetwood has the skill set and is in my range of value and projects 1 pt better in ceilings. He also played well last week.
Chalk Pairings
Who is pairing with Scheffler the most in the optimizer?
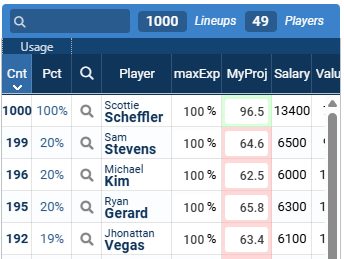
I was curious who is landing in these lineups with Scheffler the most often from an optimizer perspective so I crunched 1000 Scheffler lineups and found Stevens, Kim and Gerard all hit the optimizer 20% of the time. Vegas which is right behind at 19%. That helps visualize the following table's importance which came from my sims data I showed earlier, but now in a sortable table:
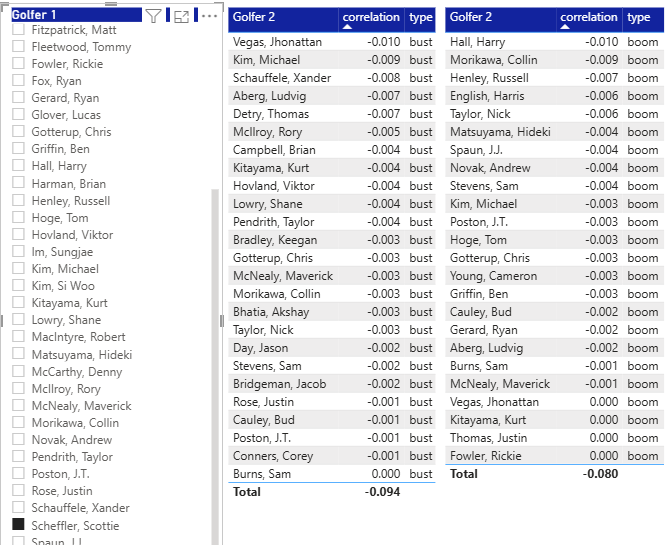
This may look weird but what I did is pull up the correlation where there is boom and bust separately and found negative correlations on both sides. Why?
Because if theres a negative correlation on bust plays, that means the two players didnt bust together that often. If there is a negative correlation on boom plays, it also means they didn't boom together that often either. That means the pair is going to potentially go lower owned together. Vegas didnt bust with Scheffler too often but was sorta even in correlation on the boom side, indicating not a ton of lineups were crafting that way and it may go under-owned as a result. I'm testing this with groups this week to try and see if i can produce lineups by pairing and elimination through an optimizer. One day I will make these tools available through a website as you sort of have to go through the players you anticipate playing to get who you want in this method.
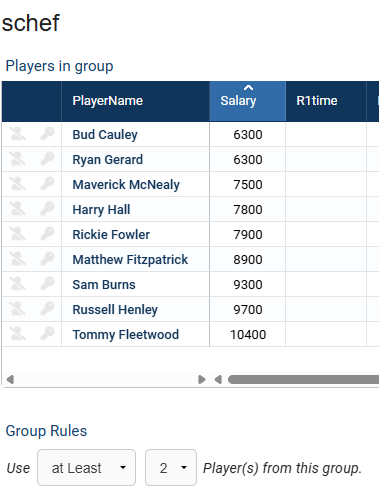
Based on this chart, I will play some Scheffler and focus those lineups on pairing these names (maybe pairs of 2):
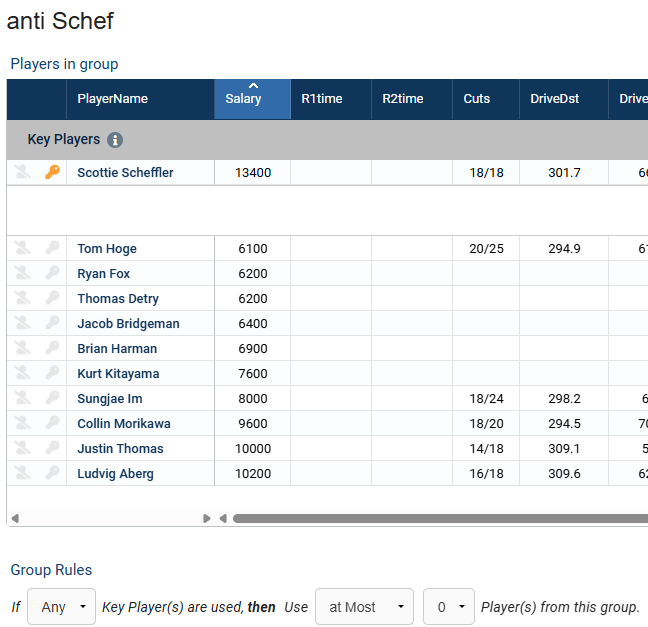
I will be avoiding players in this group specifically when playing Scheffler:
Since Scottie isnt showing up very optimal, I dont think I will go all in this week on that play.
Don't forget to like the page that brought you here if you found useful items in this writeup!


Comments