PGA Data Review and Documentation for 2025 BMW Championship
- dfsedric
- Aug 17, 2025
- 5 min read

I've been waiting for this moment to circle back and see how things ended up after releasing my first pass at sims in PGA, the night before the contest. Just going through the process, I learned quite a bit about how useful it can be and the struggles of trying to release useful data that makes sense. I hope to shed some light on what I learned in that process, things that seemingly worked well and what did not.
Lets start with a top winning lineup so that we can see the type of players who produced a top 5 finish.
Drive the Green Tournament Winning Lineup (4 way tie for 1st!)

5th


First thing to call out -is that the overall winning score was infact 554, and this was a point of confusion from the start because last time this course played wayyyy easier in 2021 where golfers were making 700+ DK scores possible. They intentionally made it a bit tougher this time around and it worked. My original projection was a winning score being around 598, while the sims actually got closer at 547.7. It seems my methodology generally works here. Based on top lineups, you either went Fleetwood or Scheffler to get one of these lineups. In the Scheffler build, MacIntyre, Hall and Mcnealy all stood out, followed by Pendrith and Kim. We will explore how those names were possible.
In the Fleetwood build-> English, Macntyre, Fowler, Hall, McNealy (3 similar names to the Schef build.
My Top Entry

This was one of my pool entries (20 max quarters) where I tested out some Scheffler specific builds based on my sim data (more coming on that). 4 of the top plays made it in this lineup intentionally.
AI (Claude) Analysis of the Data vs Actual Results:


Mistakes

This was the first of new charts I wanted to use immediately after creating this data. Most sports books don't offer top 6 odds and that drives me nuts when we need to see who has the best odds of finishing in the top 6 by price. This is what I produced, overlayed with the plays who were under owned. It def spotted McNealy from the winners circle, but the mistake? Was not filtering this down by upside like I normally do. Here is what it would have looked like instead:
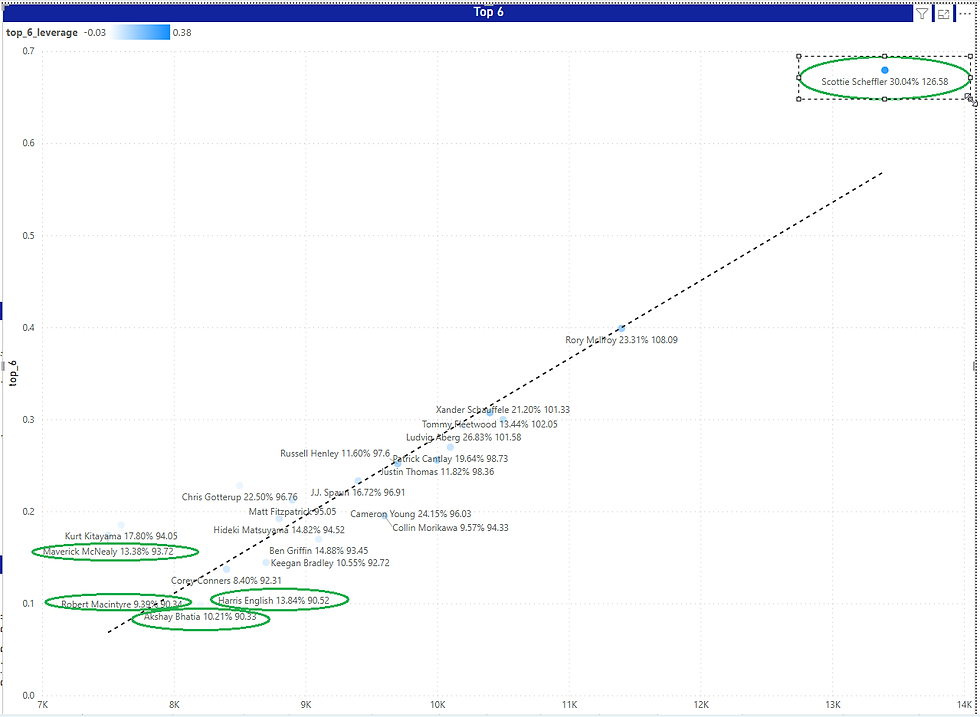
Bhatia and English were under the value line so I wouldn't have circled them but as you can see, there is a cleaner bottom level of winning plays. Robert MacIntyre almost won for 9% ownership and he definitely would have been above the line for cheap. Filtering has its risks because of the boom / bust factor for some guys (Rose last week) could be missed. I will also note that Gerard and Si Woo and Poston were all removed in that case. Kitiyama also finished top 20 for cheap.
Data Refreshing
The last data refresh (updated ownership/projections didnt happen until like 3am when I woke up and started building my own lineups. The problem then becomes the wait time between running sims (several minutes), uploading newest results, reserving lineups and trying to interpret what I am seeing in a short amount of time. Each time I rerun the sims I do get different results because there is a randomizing factor to this process as well. So many of the items I posted in the early article related to sims do not match what I saw in my final run. I cant think of any other way around that issue yet but I will see what I can do for consistency, and walk through what I think is a nice use case of the sims. Note: for me to host this, it will cost money so that could become something I offer behind a paywall in the future. Until then I will do my best to show the most relevant data I can.
What are the sims doing?
The simulator is taking 50,000 lineups that mirror what we think the field is going to do (aka reach 550+ points). Then we are optimizing lineups that have the potential to get close to that ceiling. Originally I thought maybe that would be my use case - target those lineups. Right now it isnt. Instead I am now comparing the lineups that succeed vs fail so that I can understand which players might boom or bust together based on how most lineups performed. I am also paying attention to the lineups used the most often as I think that can be predictive of a high upside build.
Boom vs Bust Tool

Even this list is different by the final run, but what this gave me was one very specific look at Scheffler, since he was the obvious chalk this week. There are 4 tables populated to the right of the Golfer 1 selection (Schef): The first two tables sorta go together and the last 2 also go together.
The first table looks at players who have a negative correlation to Scheffler when the lineup busts in the sims. It is a double negative what I just said. Harry Hall had a negative correlation to the busted lineups the most with his -0.011 correlation, which means when Scheffler busts, Hall is less likely to bust with him.
The 2nd table also looks at negative correlation to those lineups who boomed, meaning when Scheffler booms, Hall is actually less likely in the tournament lineups to boom with him. This makes him a contrarian option as the chalk is likely to go with the plays that boom with Scottie in the optimizer.
Table 3 is somewhat a fade list with Scheffler because these are positive correlations for the lineups that busted the most often. I.e. Scottie + JT lineups had a positive correlation by busting together (Yes that sounds horrible, I know). So essentially the names atop of this list are guys I didnt want to pair with Scheffler in my pool.
Table 4 - final table; are the names of players who did correlate with Scottie the most when the lineups boomed. The issue with this list is that I'd say that these are expected chalk pairings when the lineups optimize, so while they are projecting to do well together, they sorta lead you to the chalk builds based on median projections.
Summary: if you want to hand build a contrarian entry, use the 2nd table top down to locate plays that may be good without a whole lot of chalk consumption.
Deeper down the rabbit hole

I started with Scheffler because I knew I wanted to play the top odds guy in a lineup. What kept me busy all morning was I kept going down the rabbit hole. McNealy was someone showing on my charts and as a top contrarian match to Scheffler. So with that, I wanted to see who pairs well with McNealy too? Ideally on the left two charts, you want names who are negatively correlated with busting, which means if McNealy fails, Robert MacIntyre is less likely to fail with him (table 1). You can circle back to Schefflers chart and confirm that he also is contrarian side of that pairing with Scheffler (chart 2).
The lineup doesn't need to be 100% contrarian but I do think the building blocks are there to play that way. I am hoping to work out a report for this data in the future to help see things much easier. I was so tired I just let AI help me build out my optimizer groups based on the data, but it still took a couple hours.
Boom Factor Chart

I was disappointed in the number of busts on that chart in the original writeup as just about none of them boomed. In hindsight, I wish I had used some upside filtering to narrow that field same as the other charts. McNealy would have likely jumped higher and then I see Pendrith's name, although below the line. He finished in a top lineup (t15).
Potential Additions to Come

May be able to use sims to estimate which players are most likely to rise. I spot checked and McNealy was about 18% owned last week so theres that!


Comments